
14 Tables, Formulæ, Graphics and Notated Music
Table of contents
Many documents, both historical and contemporary, include not only text, but also graphics, artwork, and other images. Although some types of images can be represented directly with markup, it is more common practice to include such information by using a reference to an external entity (typically a URL) encoded in a suitable graphical notation.
In addition to graphic images, documents often contain material presented in graphical or tabular format. In such materials, details of layout and presentation may also be of comparatively greater significance or complexity than they are for running text. Indeed, it may often be difficult to make a clear distinction between details relating purely to the rendition of information and those relating to the information itself.
Documents may also contain mathematical formulæ or expressions in other formulaic notations, for which no notation is defined in these Guidelines.
Finally, documents may contain musical notation, embedded in a manner similar to tables, graphs and formulæ.
These areas (graphics, tabular material, and mathematical or other formulæ, and music) have in common that they have received considerable attention from many other standards bodies or similar professional groups. In part because of this, they may frequently be most conveniently encoded and processed using some notation not defined by these Guidelines. For these reasons, and others, we consider tables, formulæ, graphics and notated music together in this chapter.
As with text markup in general, many incompatible formats have been proposed for the representation of graphics, formulæ, and tables in electronic form. Unfortunately, no single format as effective as XML in the domain of text has yet emerged for their interchange, to some extent because of the difficulty of representing the information these data formats convey independently of the way it is rendered.
The module defined by this chapter defines special purpose ‘container’ elements that can be used to encapsulate occurrences of such data within a TEI-conformant document in a portable way. Specific recommendations for the encoding of tables are provided in section 14.1 Tables, recommendations for mathematical or other formulæ in section 14.2 Formulæ and Mathematical Expressions, and for the encoding of musical notation in section 14.3 Notated Music in Written Text. Specific recommendations for the encoding of graphic figures may be found in section 14.4 Specific Elements for Graphic Images. The rest of the chapter is devoted to general problems of encoding graphic information.
There is at the time of writing no consensus on formats for graphical images, and such formats vary in many ways. We therefore provide (in section 14.5 Overview of Basic Graphics Concepts) a brief discussion of the ways in which images may be represented, and (in section 14.6 Graphic Image Formats) a list of formal names for those representations most popular at this time. Each one includes a very brief description. These Guidelines recommend a few particular representations as being the most widely supported and understood.
TEI: Tables¶14.1 Tables
A table is the least ‘graphic’ of the elements discussed in this chapter. Almost any text structure can be presented as a series of rows and columns: one might, for example, choose to show a glossary or other form of list in tabular form, without necessarily regarding it as a table. In such cases, the global rend attribute is an appropriate way of indicating that some element is being presented in tabular format, for example by using an appropriate display property in CSS. When tabular presentation is regarded as of less intrinsic importance, it is correspondingly simpler to encode descriptive or functional information about the contents of the table, for example to identify one cell as containing a name and another as containing a date, though the two methods may be combined.
When, however, particular elements are required to encode the tabular arrangement itself, then one or other of the various ‘table schemas’ now available may be preferable. The schemas in common use generally view a table as a special text element, made up of row elements, themselves composed of cells. Table cells generally appear in row-major order, with the first row from left to right, then the second row, and so on. Details of appearance such as column widths, border lines, and alignment are generally encoded by numerous attributes. Beyond this, however, such schemas differ greatly. This section begins by describing a table schema of this kind; a brief summary of some other widely available table schemas is also provided in section 14.1.2 Other Table Schemas.
TEI: TEI Tables¶14.1.1 TEI Tables
For encoding tables of low to moderate complexity, these Guidelines provide the following special purpose elements:
- table contains text displayed in tabular form, in rows and columns.
rows indicates the number of rows in the table. cols (columns) indicates the number of columns in each row of the table. - row contains one row of a table.
- cell contains one cell of a table.
The table element is defined as a member of the class model.inter; it may therefore appear both within other components (such as paragraphs), or between them, provided that the module defined in this chapter has been enabled, as described at the beginning of this chapter.
It is to a large extent arbitrary whether a table should be regarded as a series of rows or as a series of columns. For compatibility with currently available systems, however, these Guidelines require a row-by-row description of a table. It is also possible to describe a table simply as a series of cells; this may be useful for tabular material which is not presented as a simple matrix.
The attributes rows and cols may be used to indicate the size of a table, or to indicate that a particular cell or row of a table spans more than one row or column. For both tables and cells, rows and columns are always given in top-to-bottom, left-to-right order, although formatting properties such as those provided by CSS may be used to specify that they should be displayed differently. These Guidelines do not require that the size of a table be specified; for most formatting and many other applications, it will be necessary to process the whole table in two passes in any case.
Where cells span more than one column or row, the encoder must determine whether this is a purely presentational effect (in which case the rend attribute may be more appropriate), whether the part of the table affected would be better treated as a nested table, or whether to use the spanning attributes listed above.
The role attribute may be used to categorize a single cell, or set a default for all the cells in a given row. The present Guidelines distinguish the roles of label and data only, but the encoder may define other roles, such as ‘derived’, ‘numeric’, etc., as appropriate.
These three attributes are provided by the attribute class att.tableDecoration of which both cell and row are members; see further 1.3.1 Attribute Classes.
<head rend="it">Report of the conduct and progress of Ernest
Pontifex. Upper Vth form — half term ending Midsummer 1851</head>
<row>
<cell role="label">Classics</cell>
<cell>Idle listless and unimproving</cell>
</row>
<row>
<cell role="label">Mathematics</cell>
<cell>ditto</cell>
</row>
<row>
<cell role="label">Divinity</cell>
<cell>ditto</cell>
</row>
<row>
<cell role="label">Conduct in house</cell>
<cell>Orderly</cell>
</row>
<row>
<cell role="label">General conduct</cell>
<cell>Not satisfactory, on account of his great unpunctuality and
inattention to duties</cell>
</row>
</table>
Note that this encoding makes no attempt to represent the full significance of the ‘ditto’ cells above; these might be regarded as simple links between the cells containing them and that to which they refer, or as virtual copies of it. For ways of representing either interpretation, see chapter 16 Linking, Segmentation, and Alignment.
<head>Poor Man's Lodgings in Norfolk (Mayhew, 1843)</head>
<row role="label">
<cell/>
<cell>Dossing Cribs or Lodging Houses</cell>
<cell>Beds</cell>
<cell>Needys or Nightly Lodgers</cell>
</row>
<row>
<cell role="label">Bury St Edmund's</cell>
<cell>5</cell>
<cell>8</cell>
<cell>128</cell>
</row>
<row>
<cell role="label">Thetford</cell>
<cell>3</cell>
<cell>6</cell>
<cell>36</cell>
</row>
<row>
<cell role="label">Attleboro'</cell>
<cell>3</cell>
<cell>5</cell>
<cell>20</cell>
</row>
<row>
<cell role="label">Wymondham</cell>
<cell>1</cell>
<cell>11</cell>
<cell>22</cell>
</row>
</table>
Note the use of a blank cell in the first row to ensure that the column labels are correctly aligned with the data. Again, this encoding does not explicitly represent the alignment between column and row labels and the data to which they apply. Where the primary emphasis of an encoding is on the semantic content of a table, a more explicit mechanism for the representation of structured information such as that provided by the feature structure mechanism described in chapter 18 Feature Structures may be preferred. Alternatively, the general purpose linkage and alignment mechanisms described in chapter 16 Linking, Segmentation, and Alignment may also be applied to individual cells of a table.
<head>US State populations, 1990</head>
<row>
<cell>
<name>Wyoming</name>
</cell>
<cell>
<num>453,588</num>
</cell>
</row>
<row>
<cell>
<name>Alaska</name>
</cell>
<cell>
<num>550,043</num>
</cell>
</row>
<row>
<cell>
<name>Montana</name>
</cell>
<cell>
<num>799,065</num>
</cell>
</row>
<row>
<cell>
<name>Rhode Island</name>
</cell>
<cell>
<num>1,003,464</num>
</cell>
</row>
</table>
The use of semantically marked elements within a cell enables the encoder to convey something about the nature and significance of the information, rather than merely suggesting how to display it in rows and columns.
<head>US State populations, 1990</head>
<row>
<cell role="statename">Wyoming </cell>
<cell role="pop">453,588 </cell>
</row>
<row>
<cell role="statename">Alaska </cell>
<cell role="pop">550,043 </cell>
</row>
<row>
<cell role="statename">Montana </cell>
<cell role="pop">799,065 </cell>
</row>
<row>
<cell role="statename">Rhode Island</cell>
<cell role="pop">1,003,464</cell>
</row>
</table>
<head>The Table of Battallions, reduced out of the grand square of
men.</head>
<row>
<cell>1</cell>
<cell>2</cell>
<cell>3</cell>
<cell>4</cell>
</row>
<!-- ... -->
<row>
<cell>841</cell>
<cell>3</cell>
<cell>289 289 256</cell>
<cell>7</cell>
</row>
<trailer>The end of the Table of Battallions reduced out of the
battels of g. and squares of men: vpon the right side of euery
leafe.</trailer>
</table>
TEI: Other Table Schemas¶14.1.2 Other Table Schemas
Many authoring systems include built-in support for their own or for public table schemas. These provide an enhanced user interface and good formatting capabilities, but are often product-specific, despite their use of a XML markup language.
The DTD developed by the Association of American Publishers (AAP) and standardized in ANSI Z39.59 provided a very simple encoding for correspondingly simple tables. This has been further developed, together with the table DTD documented in ISO Technical Report 9537, and now forms part of ISO 12083. The TEI table model described above has functionality very similar to that defined by ISO 12083.
For more complex tables, the most effective publicly-available DTD is probably that developed by the US Department of Defense CALS project. This supports vertical and horizontal spanning and various kinds of text rotation and justification within cells and is also directly supported by a number of existing XML software systems.
The CALS table model is much too complex to describe fully here; for historical background see http://archive.is/gGzsZ; for more recent simplifications of it and current implementations see https://www.oasis-open.org/specs/tablemodels.php. As with any other XML vocabulary, the XML version of the CALS model may readily be included in a TEI schema, using the techniques described in 23.3 Customization.
The XHTML table model (XHTML™ 1.0 The Extensible HyperText Markup Language (Second Edition) (2000)) is based on the HTML table model (Ragget et al. (eds.) (1999)). Both models support arrangement of arbitrary data into rows and columns of cells. Table rows and columns may be grouped to convey additional structural information and may be rendered by user agents in ways that emphasize this structure. Support for incremental rendering of tables and for rendering on ‘non-visual’ user agents is also available. Special elements and attributes are provided to associate metadata with tables. They indicate the table's purpose, or are for the benefit of people using speech or Braille-based user agents. Tables are not recommended for use purely as a means to lay out document content, as this leads to many accessibility problems (see further http://www.w3.org/TR/WCAG10-HTML-TECHS/#tables). Stylesheets provide a far more effective means of controlling layout and other visual characteristics in both HTML and XML documents.
TEI: Formulæ and Mathematical Expressions¶14.2 Formulæ and Mathematical Expressions
Mathematical and chemical formulæ pose problems similar to those posed by tables in that rendition may be of great significance and hard to disentangle from content. They also require access to a wide range of special characters, for most of which standard entity names already exist in the documented ISO entity sets (see further chapters vi. Languages and Character Sets and 5 Characters, Glyphs, and Writing Modes).
Formulæ and tables are also similar in that well-researched and detailed DTD fragments have already been developed for them independently of the TEI. They differ in that (for mathematics at least) there also exists a richly detailed text-based but non-XML notation which is very widely used: this is the TeX system, and the sets of descriptive macros developed for it such as LaTeX, AMS-TeX, and AMS-LaTeX.
The AAP and ISO standards mentioned in section 14.1 Tables above both provide DTDs for equations as well as for tables, which now form part of ISO 12083. The European Mathematical Trust, an organization set up specifically to enhance research support for European mathematicians, has also defined a general purpose mathematical DTD known as EuroMath (http://xml.coverpages.org/emt-ukc-index.html), for which it provides both software and services.
Most if not all of the functionality provided by these DTDs can now be found in the OpenMath and MathML XML-based systems briefly described below.
As with tables, in all the XML solutions a tension exists between the need to encode the way a formula is written (its appearance) and the need to represent its semantics. If the object of the encoding is purely to act as an interchange format among different formatting programs, then there is no need to represent the mathematical meaning of an expression. If however the object is to use the encoding as input to an algebraic manipulation system (such as Mathematica or Maple) or a database system, clearly simply representing superscripts and subscripts will be inadequate.
The formula element provided by these Guidelines makes no attempt to represent the internal structure of formulæ.
- formula contains a mathematical or other formula.
1\cr&lt;0&amp;>1}$</formula>
Alternatively, if more detailed markup is desired, the content of the formula element may be redefined to include elements defined by some other XML vocabulary, such as that of ISO 12083, or to use elements from the OpenMath or MathML schemas.
animal a headstart of ten meters. Achilles runs those ten meters, the
tortoise one; Achilles runs that meter, the tortoise runs a decimeter;
Achilles runs that decimeter, the tortoise runs a centimeter; Achilles
runs that centimeter, the tortoise, a millimeter; Fleet-footed
Achilles, the millimeter, the tortoise, a tenth of a millimeter, and
so on to infinity, without the tortoise ever being overtaken. . . Such
is the customary version.
<!-- ... --> The problem does not change, as
you can see; but I would like to know the name of the poet who
provided it with a hero and a tortoise. To those magical competitors
and to the series <formula notation="TeX">$$ {1 \over 10} + {1 \over
100} + {1 \over 1000} + {1 \over 10,\!000} + \dots $$</formula> the
argument owes its fame.</p>
<m:mfrac>
<m:mrow>
<m:mn>1</m:mn>
</m:mrow>
<m:mrow>
<m:mn>10</m:mn>
</m:mrow>
</m:mfrac>
<m:mo>+</m:mo>
<m:mfrac>
<m:mrow>
<m:mn>1</m:mn>
</m:mrow>
<m:mrow>
<m:mn>100</m:mn>
</m:mrow>
</m:mfrac>
<m:mo>+</m:mo>
<m:mfrac>
<m:mrow>
<m:mn>1</m:mn>
</m:mrow>
<m:mrow>
<m:mn>1000</m:mn>
</m:mrow>
</m:mfrac>
<m:mo>+</m:mo>
<m:mfrac>
<m:mrow>
<m:mn>1</m:mn>
</m:mrow>
<m:mrow>
<m:mn>10000</m:mn>
</m:mrow>
</m:mfrac>
<m:mo>+</m:mo>
<m:mo>…</m:mo>
</m:math>
MathML 2.0 provides support for a ‘Semantic Math-Web’, XML namespaces, and other current XML standards, such as XML DOM, OMG IDL, ECMAScript, and Java. It also provides a modularized version of the MathML DTD so that MathML fragments ‘embedded’ in XHTML 1.1 documents can be correctly validated.
The OpenMath (http://www.nag.co.uk/projects/OpenMath.html) project is coordinated by the OpenMath Society (http://www.openmath.org/) and funded by the European Commission under the Esprit Multimedia Standards Initiative that commenced in September 1997. It is likely to become a key standard for communicating semantically rich representations of mathematical objects both on and off the Web in a platform-independent manner.
The OpenMath Standard (http://www.openmath.org/standard/om20-2004-06-30/) consists of specifications for
- OpenMath objects, representing the structure of formulæ (http://www.openmath.org/standard/om20-2004-06-30/omstd20html-2.xml#cha_obj);
- Content Dictionaries, providing semantic context (http://www.openmath.org/standard/om20-2004-06-30/omstd20html-4.xml#cha_cd);
- Encodings, both binary (http://www.openmath.org/standard/om20-2004-06-30/omstd20html-3.xml#sec_binary) and XML (http://www.openmath.org/standard/om20-2004-06-30/omstd20html-3.xml#sec_xml).
OpenMath and MathML have certain common aspects. They both use prefix operators, both are XML-based and they both construct their objects by applying certain rules recursively. Such similarities facilitate mapping between the two standards. There are also some key differences between MathML and OpenMath. OpenMath does not provide support for presentation of mathematical objects and its scope of semantically-oriented elements is much broader that of MathML, with the expressive power to cover virtually all areas of computational mathematics. In fact, a particular set of Content Dictionaries, the ‘MathML CD Group’, covers the same areas of mathematics as the Content Markup elements of MathML 2.0.
Finally, OMDoc (http://omdoc.org/) is an extension of the OpenMath standard that supplies markup for structures such as axioms, theorems, proofs, definitions, texts (mixing formal content with mathematical text).
is given by the formula: <formula xml:id="f12" n="12" rend="inline">
<m:math>
<m:mi>V</m:mi>
<m:mo>=</m:mo>
<m:mfrac>
<m:mrow>
<m:mn>4</m:mn>
</m:mrow>
<m:mrow>
<m:mn>3</m:mn>
</m:mrow>
</m:mfrac>
<m:mi>π</m:mi>
<m:msup>
<m:mrow>
<m:mi>r</m:mi>
</m:mrow>
<m:mrow>
<m:mn>3</m:mn>
</m:mrow>
</m:msup>
</m:math>
</formula> which is readily calculated.</p>
<p>As we have seen in equation <ptr target="#f12"/>, ... </p>
TEI: Notated Music in Written Text¶14.3 Notated Music in Written Text
Music, like many other art forms, is often mentioned, discussed and described in writings of various kinds. This applies to both historical and contemporary documents, even though methods of notating music have changed considerably in western history. In most cases, music notation enters the text flow in a way similar to figures, images or graphs. On other occasions, elements of music notation are treated as inline characters in running text.
notatedMusic provides a way to signal the presence of music notation in text, but defer to other representations, which are not covered by the TEI guidelines, to describe the music notation itself. In fact, several commercial, academic and standard bodies have developed digital representations of music notation, and given the topic's complexity, these representations often focus on different aspects and adopt different methodologies. Therefore, notatedMusic only defines a container element to encode the occurrence of music notation and allows linking to the data format preferred by the encoder. (Note: notatedMusic is not the same as musicNotation, a metadata element, which is used to describe musical notation that appears in a manuscript. See 10 Manuscript Description.)
The following elements can be used for encoding music notation in text:
- notatedMusic encodes the presence of music notation in a text
- ptr (pointer) defines a pointer to another location.
- desc (description) contains a brief description of the object documented by its parent element, typically a documentation element or an entity.
- graphic indicates the location of a graphic or illustration, either forming part of a text, or providing an image of it.
- binaryObject provides encoded binary data representing an inline graphic, audio, video or other object.
- notatedMusic groups elements representing or containing music notation.
- ptr can be used to indicate the location of a representation of the music notation.
- mimeType supplies the MIME type of the data format, when available.
- desc can be used to give a prose description of the notated music.
- graphic can be used to indicate the location of a graphical representation of the music notation.
- binaryObject provides encoded binary data which constitutes another representation of the music notation (e.g. audio).
The notatedMusic element may contain a textual description and pointers to various representations of the music notation in different media. An external representation of the notated music is specified using the ptr element, whose target attribute provides its electronically-accessible location. The attribute mimeType supplies the MIME type of the data format when available. For example:
<ptr target="bar1.xml"/>
</notatedMusic>
A textual description of the notation can be provided within the desc element; alternatively, a label may be supplied. For example:
<ptr target="bar1.xml"/>
<desc>First bar of Chopin's Scherzo No.3 Op.39</desc>
</notatedMusic>
It is possible to link to any kind of music notation data format. However, when a MIME type is not available, it is recommended that the format be specified in the description. See the following examples.
MIME type available:
<ptr target="bar1.xml"
mimeType="application/vnd.recordare.musicxml"/>
<desc>First bar of Chopin's Scherzo No.3 Op.39. Encoded in
MusicXML.</desc>
</notatedMusic>
MIME type not available:
<ptr target="bar1.ly"/>
<desc>First bar of Chopin's Scherzo No.3 Op.39. Encoded in
Lilypond.</desc>
</notatedMusic>
Application format:
<ptr target="bar1.mscz"
mimeType="application/x-musescore"/>
<desc>First bar of Chopin's Scherzo No.3 Op.39. MuseScore Notation
Software format.</desc>
</notatedMusic>
It is possible to specify the location of digital objects representing the notated music in other media such as images or audio-visual files. The interpretation of the correspondence between the notated music and these digital objects is not encoded explicitly. We recommend the use of graphic and binaryObject mainly as a fallback mechanism when the notated music format is not displayable by the application using the encoding. The alignment of encoded notated music, images carrying the notation, and audio files is a complex matter for which we refer the reader to other formats and specifications such as MPEG-SMR.
<ptr target="bar1.xml"/>
<graphic url="bar1.jpg"/>
<desc>First bar of Chopin's Scherzo No.3 Op.39</desc>
</notatedMusic>
It is also recommended, when useful, to embed XML-based music notation formats, such as the Music Encoding Initiative format as content of notatedMusic. This must be done by means of customization.
In modern printing, music notation positioned between blocks of text for illustrative purposes is usually referred to as a ‘figure’ or ‘example’. In this cases, we recommend the inclusion of notatedMusic in figure in order to encode possible captions and headers. For example:
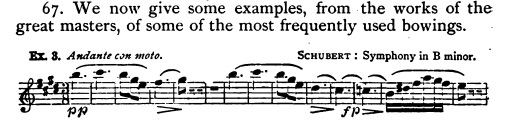
<p> We now give some examples, from the works of the great masters, of
some of the most frequently used bowings. </p>
<figure n="Ex. 3">
<head>SCHUBERT: Symphony in B minor.</head>
<notatedMusic>
<ptr target="example_schubert.xml"/>
</notatedMusic>
</figure>
</div>
TEI: Specific Elements for Graphic Images¶14.4 Specific Elements for Graphic Images
The following special purpose elements are used to indicate the presence of graphic images within a document:
- figure groups elements representing or containing graphic information such as an illustration, formula, or figure.
- graphic indicates the location of a graphic or illustration, either forming part of a text, or providing an image of it.
- binaryObject provides encoded binary data representing an inline graphic, audio, video or other object.
- figDesc (description of figure) contains a brief prose description of the appearance or content of a graphic figure, for use when documenting an image without displaying it.
The graphic and binaryObject elements form part of the common core module, and are discussed in section 3.9 Graphics and Other Non-textual Components.
<graphic url="Fig1.pdf"/>
</figure>
<graphic url="Fig1.pdf"/>
<head>The View from the Bridge</head>
</figure>
<graphic url="pullman.png"/>
<head>Above:</head>
<p>The drawing room of the Pullman house, the white and gold saloon
where the magnate delighted in giving receptions for several hundred
people.</p>
<figDesc>The figure shows an elaborately decorated room, at least
twenty-five feet side to side and fifty feet long, with ornate
mouldings and Corinthian columns on the walls, overstuffed armchairs
and loveseats arranged in several conversational groupings, and two
large chandeliers.</figDesc>
</figure>
<graphic url="Fig1.jpg"/>
<head>Figure One: The View from the Bridge</head>
<figDesc>A Whistleresque view showing four or five sailing boats in
the foreground, and a series of buoys strung out between
them.</figDesc>
</figure>
Where the graphic itself contains large amounts of text, perhaps with a complex structure, and perhaps difficult to distinguish from the graphic, the encoder should choose whether to regard the graphic as containing the text (in which case, a nested floatingText element may be included within the figure element) or to regard the enclosed text as being a separate division of the text element in which the graphic appears. In this latter case, an appropriate div or div1 (etc.) element may be used for the text represented within the graphic, and the figure element embedded within it. The choice will depend to a large degree on the encoder's understanding of the relationship between the graphic and the surrounding text.
<figure n="a">
<graphic url="./figs/6.45a.png"/>
<ab type="caption">Parallel</ab>
</figure>
<figure n="b">
<graphic url="./figs/6.45b.png"/>
<ab type="caption">Perspective</ab>
</figure>
<ab type="caption">The two canonical view volumes, for the (a)
parallel and (b) perspective projections. Note that -z is to the
right.</ab>
</figure>
Like any other element in the TEI scheme, figures may be given identifiers so that they can be aligned with other elements, and linked to or from them, as described in chapter 16 Linking, Segmentation, and Alignment. Some common examples are discussed briefly here; full information is provided in that chapter.
here <graphic url="fig1th.png"/> for enlightenment </ref>
<figure xml:id="IM1">
<graphic url="fig1.jpg"/>
</figure>
Another common requirement is to associate part or the whole of an image with a textual element not necessarily contiguous to it in the text; this is sometimes known as a callout. When the module for transcription is included in a schema, specific attributes for parts of a text and parts (or all) of a digital image are available; these are discussed in 11.1 Digital Facsimiles. In addition, chapter 16 Linking, Segmentation, and Alignment may be consulted for other mechanisms available for this purpose.
The following example assumes that we wish to associate one portion of the image held as ‘fig1’ with chapter two of some text, and another portion of it with chapter three. The application may be thought of as a hypertext browser in which the user selects from a graphic image which part of a text to read next, but the mechanism is independent of this particular application.
<ptr xml:id="PD2" target="Fig1.svg#object2"/>
viewBox="2 1 8 3">
<g id="object1">
<ellipse style="fill: #ffffff" cx="3.875"
cy="3.025" rx="1.175" ry="1.175"/>
</g>
<g id="object2">
<rect style="fill: #a81616" x="7.8"
y="1.9" width="2.17581" height="2.24833"/>
</g>
</svg>
<!-- ... -->
</div1>
<div1 type="chapter" xml:id="CHAP2">
<!-- ... -->
</div1>
<link target="#CHAP1 #PD1"/>
<link target="#CHAP2 #PD2"/>
</linkGrp>
In this example, the SVG representation of the graphic is stored externally to the TEI document and linked by means of a pointer. It is also possible to embed the SVG representation directly within the TEI by extending the content model of the figure element to permit an element <svg> from the SVG namespace. Like other customizations of the TEI scheme, this is carried out using the techniques documented in section 1.2 Defining a TEI Schema; further examples are provided in chapter 16 Linking, Segmentation, and Alignment.
TEI: Overview of Basic Graphics Concepts¶14.5 Overview of Basic Graphics Concepts
The first major distinction in graphic representation is that between raster graphics and vector graphics. A raster image is a list of points, or dots. Scanners, fax machines and other simple devices easily produce digital raster images, and such images are therefore quite common. A vector image, in contrast, is a list of geometrical objects, such as lines, circles, arcs, or even cubes. These are much more difficult to produce, and so are mainly encountered as the output of sophisticated systems such as architectural and engineering CAD programs.
Raster images are difficult to modify because by definition they only encode single points: a line, for example, cannot grow or shrink as such, since it is not identified as such. Only its component parts are identified, and only they can be manipulated. Therefore the resolution or dot-size of a raster image is important, which is not the case with vector images. It is also far more difficult to convert raster images to vector images than to perform the opposite conversion. Raster images generally require more storage space than vector images, and a wide variety of methods exists for compressing them; the variation in these methods leads to corresponding variations in representations for storage and transmission of raster images.
Motion video usually consists of a long series of raster images. Data compression is even more effective on video than on single raster images (mainly owing to redundancy which arises from the usual similarity of adjacent frames). Notations for representing full-motion video are hotly debated at this time, and any user of these Guidelines would do well to obtain up-to-date expert advice before undertaking a project using them.
The compression methods used with any of these image types may be ‘lossy’ or ‘lossless’. Methods for lossy compression save space by discarding a small portion of the image's detail, such as fine distinctions of shading. When decompressed, therefore, such an image will be only a close approximation of the original. In contrast, lossless compression guarantees that the exact uncompressed image will be reproducible from the compressed form: only truly redundant information is removed. In general, therefore, lossless compression does not save quite so much space as lossy compression, though it does guarantee fidelity to the original uncompressed image.
Raster images may be characterized by their resolution, which is the number of dots per inch used to represent the image. Doubling the resolution will give a more precise image, but also quadruple the storage requirement (before compression), and affect processing time for any operations to be performed, such as displaying an image for a reader. Motion video also has resolution in time: the number of frames to be shown per second. Encoders should consider carefully what resolution(s) and frame rate(s) to use for particular applications; these Guidelines express no recommendation in this matter, save the universal ones of consistency and documentation.
Within any image, it is typical to refer to locations via Cartesian coordinate axes: values for x, y, and sometimes z and/or time. However, graphic notations vary in whether coordinates count from left-to-right and top-to-bottom, or another way. They also vary in whether coordinates are considered real (inches, millimeters, and so on), or virtual (dots). These Guidelines do not recommend any of these methods over another, but all decisions made should be applied consistently, and documented in the encodingDesc section of the TEI header.53
Methods of aligning images and text are discussed in 11.1 Digital Facsimiles.
The chromatic values of an image may be rendered in many different ways. In monochrome images every displayed point is either black or white. In grayscale images, each point is rendered in some shade of gray, the number of shades varying from system to system. In true polychrome images, points are rendered in different hues, again with varying limitations affecting the number of distinct shades and the means by which they are displayed.
TEI: Graphic Image Formats¶14.6 Graphic Image Formats
As noted above, there exists a wide variety of different graphics formats, and the following list is in no way exhaustive. Moreover, inclusion of any format in this list should not be taken as indicating endorsement by the TEI of this format or any products associated with it. Some of the formats listed here are proprietary to a greater or lesser extent and cannot therefore be regarded as standards in any meaningful sense. They are however widely used by many different vendors.
The following formats are widely used at the present time, and likely to remain supported by more than one vendor's software:
- BMP: Microsoft bitmap format
- CGM: Computer Graphics Metafile
- GIF: Graphics Interchange Format
- JPEG: Joint Photographic Expert Group
- PBM: Portable Bit Map
- PCX: IBM PC raster format
- PICT: Macintosh drawing format
- PNG: Portable Network Graphics format
- Photo-CD: Kodak Photo Compact Disk format
- QuickTime: Apple real-time image system
- SMIL: Synchronized Multimedia Integration Language format
- SVG: Scalable Vector Graphics format
- TIFF: Tagged Image File Format
Brief descriptions of all the above are given below. Where possible, current addresses or other contact information are shown for the originator of each format. Many formal standards, especially those promulgated by ISO and many related national organizations (ANSI, DIN, BSI, and many more), are available from those national organizations. Addresses may be found in any standard organizational directory for the country in question.
TEI: Vector Graphic Formats¶14.6.1 Vector Graphic Formats
- CGM: Computer Graphics Metafile
- This vector graphics format is specified by an ISO standard, ISO 8632:1987, amended in 1990. It defines binary, character, and plain-text encodings; the non-binary forms are safer for blind interchange, especially over networks. Documentation on CGM is available from ISO and from its member national bodies such as AFNOR, ANSI, BSI, DIN, JIS, etc.
- SVG: Scalable Vector Graphics format
- SVG is a language for describing two-dimensional vector and mixed vector or raster graphics in XML. It is defined by the Scalable Vector Graphics (SVG) 1.0 Specification, W3C Recommendation, 04 September 2001, and is available at http://www.w3.org/TR/2001/REC-SVG-20010904/.
- PICT: Macintosh drawing format
- This format is universally supported on Macintosh (tm) systems, and readable by a limited range of software for other systems. Documentation is available from Apple Computer Company, Cupertino, California USA.
TEI: Raster Graphic Formats¶14.6.2 Raster Graphic Formats
- PNG: Portable Network Graphics format
- PNG is a non-proprietary raster format currently widely available. It provides an extensible file format for the lossless, portable, well-compressed storage of raster images. Indexed-color, grayscale, and truecolor images are supported, plus an optional alpha channel. Sample depths range from 1 to 16 bits. It is defined by IETF RFC 2083, March 1997.
- TIFF: Tagged Image File Format
- Currently the most widely supported raster image format, especially for black and white images, TIFF is also one of the few formats commonly supported on more than one operating system. The drawback to TIFF is that it actually is a wrapper for several formats, and some TIFF-supporting software does not support all variants. TIFF files may use LZW, CCITT Group 4, or PackBits compression methods, or may use no compression at all. Also, TIFF files may be monochrome, grayscale, or polychromatic. All such options should be specified in prose at the end of the encodingDesc section of the TEI header for any document including TIFF images. TIFF is owned by Aldus Corporation. Documentation on TIFF is available from them at Craigcook Castle, Craigcook Road, Edinburgh EH4 3UH, Scotland, or 411 First Avenue South, Seattle, Washington 98104 USA.
- GIF: Graphics Interchange Format
- Raster images are widely available in this form, which was created by CompuServe Information Services, but has by now been implemented for many other systems as well. Documentation on GIF is copyright by, and is available from, CompuServe Incorporated, Graphics Technology Department, 5000 Arlington Center Boulevard, Columbus, Ohio 43220 USA.
- PBM: Portable Bit Map
- PBM files are easy to process, eschewing all compression in favor of transparency of file format. PBM files can, of course, be compressed by generic file-compression tools for storage and transfer. Public domain software exists which will convert many other formats to and from PBM. Documentation on PBM is copyright by Jeff Poskanzer, and is available widely on the Internet.
- PCX: IBM PC raster format
- This format is used by most IBM PC paint programs, and supports both monochrome and polychromatic images. Documentation is available from ZSoft Corporation, Technical Support Department, ATTN: Technical Reference Manual, 450 Franklin Rd. Suite 100, Marietta, GA 30067 USA.
- BMP: Microsoft bitmap format
- This format is the standard raster format for computer using Microsoft Windows (tm) or Presentation Manager (tm). Documentation is available from Microsoft Corporation.
TEI: Photographic and Motion Video Formats¶14.6.3 Photographic and Motion Video Formats
- JPEG: Joint Photographic Experts Group
- This standard is sponsored by CCITT and by ISO. It is ISO/IEC Draft International Standard 10918-1, and CCITT T.81. It handles monochrome and polychromatic images with a variety of compression techniques. JPEG per se, like CCITT Group IV, must be encapsulated before transmission; this can be done via TIFF, or via the JPEG File Interchange Format (JFIF), as commonly done for Internet delivery.
- QuickTime: Apple real-time image system
- QuickTime is a proprietary method introduced by Apple Computer Company to synchronize the display of various data. The data can include frames of video, sound, lighting control mechanisms, and other things. Viewers for QuickTime productions are available for Apple and other computers. Further information is available from Apple Computer Incorporated, 10201 North de Anza Boulevard MS 23AQ, Cupertino, California 95014 USA.
- Photo-CD: Kodak Photo Compact Disk format
- This format was introduced by Kodak for rasterizing photographs and storing them on CD-ROMs (about one hundred 35mm file images fit on one disk), for display on televisions or CD-I systems. Information on Photo-CD is available from Kodak Limited, Research and Development, Headstone Drive, Harrow, Middlesex HA1 4TY, UK.
- SMIL: Synchronized Multimedia Integration Language format
- SMIL is a W3C Recommendation which supports the integration of independent multimedia objects into a synchronized multimedia presentation. It provides multimedia authors with easily-defined basic timing relationships, fine-tuned synchronization, spatial layout, direct inclusion of non-text and non-image media objects, hyperlink support for time-based media, and adaptiveness to varying user and system characteristics. SMIL 1.0 (http://www.w3.org/TR/REC-smil/) became a W3C Recommendation on June 15, 1998, and was further developed in SMIL 2.0. SMIL 2.0 adds native support for transitions, animation, event-based interaction, extended layout facilities, and more sophisticated timing and synchronization primitives to the SMIL 1.0 language. It also allows reuse of SMIL syntax and semantics in other XML-based languages, in particular those who need to represent timing and synchronization. For example, SMIL 2.0 components are used for integrating timing into XHTML Document Types and into SVG. SMIL 2.0 also provides recommendations for Document Types based on SMIL 2.0 Modules (http://www.w3.org/TR/2005/REC-SMIL2-20050107/smil-modules.html). One such Document Type is the SMIL 2.0 Language Profile (http://www.w3.org/TR/2005/REC-SMIL2-20050107/smil20-profile.html). It contains support for all of the major SMIL 2.0 features including animation, content control, layout, linking, media object, meta-information, structure, timing, and transition effects and is designed for Web clients that support direct playback from SMIL 2.0 markup. SMIL 2.0 (http://www.w3.org/TR/2001/REC-smil20-20010807/) became a W3C Recommendation on August 7, 2001, becoming the first vocabulary to provide XML Schema support and to have reached such status.
As noted above, the reader will encounter many, many other graphics formats.
TEI: Module for Tables, Formulæ, Notated Music, and Graphics¶14.7 Module for Tables, Formulæ, Notated Music, and Graphics
The module described in this chapter provides the following features:
- Module figures: Tables, formulæ, notated music, and figures
The selection and combination of modules to form a TEI schema is described in 1.2 Defining a TEI Schema.